
Introducing the all new Flurry Analytics, which is one of the most popular free tool used by the app developers to track the aggregate data of the app users. It is similar to the Google Analytics used for the websites. You can use Flurry Analytics tool to measure and analyze the activities of the mobile users’ as well the engagement and behavior.
Flurry Analytics is the new portal with complete functionality, newly released features and helpful in finding the metrics of the app users. At present, Flurry Analytics are tracking more smartphone users than the search engines and the social medias.
You can use Flurry Analytics in both iOS and Android. Among the other analytics tool, Flurry provides the critical data allowing you to better understand the issues and provide the best solution for the user’s problem even after they download the apps.

Major Benefits Of Flurry Analytics
- Ability to track multiple apps simultaneously
- Ease to compare iOS versus Android in-app purchases
- Can generate advanced reports for complex analysis
- Can customize the app groups for easy access and view
- Creates deep understanding about user’s interest and their intent.
What are the main features that are available in Flurry Analytics?
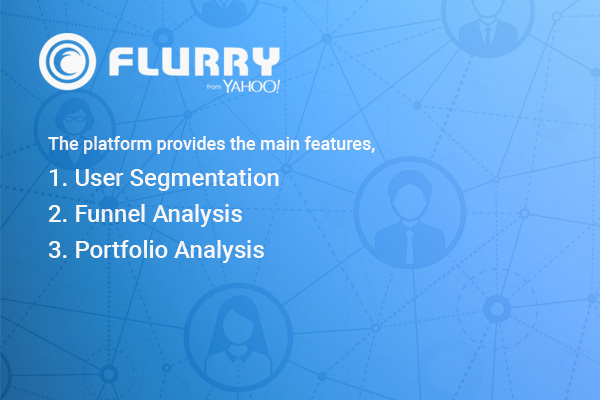
The platform provides the main features,
User Segmentation
You can categorize the user segments as such paying users versus non-paying users and light users versus heavy users, active users and their genders.
Funnel Analysis
You can discover how your customers/users are progressing through the specific path, the consumer conversions, and the other trending metrics.
Portfolio Analysis
It is helpful for the organization to manage the entire portfolio of the mobile applications. It has an ability to monitor the data about overlapping among applications and as well can track the up-selling and cross-selling conversions
How is Flurry Analytics different from other analytics?
(a) Crash Analytics
You can analyze the error and crash by app version and firmware, this is one of the parts of Flurry Analytics Solution.
(b) Data Benchmark
View according to the benchmark category to discover about your app performing
(c) Demographic Analytics
Can estimate the accurate user’s active age and gender to understand the segments of the user.
(d) Free of cost
You can track the user data for completely free with no data limits.
(e) Analytics of user acquisition
You can analyze and monitor the user acquisition by measuring the performance and effort of a specific campaign.
Flock to Flurry Analysis,
If you haven’t guessed already, what’s happening with the App analytics? According to Forbes, meet the company’s app analytics and their accesses.
According to Simon Khalaf, SVP, the senior vice president of Product & Engineering for publisher products in Yahoo states the Flurry footprint over the previous years.
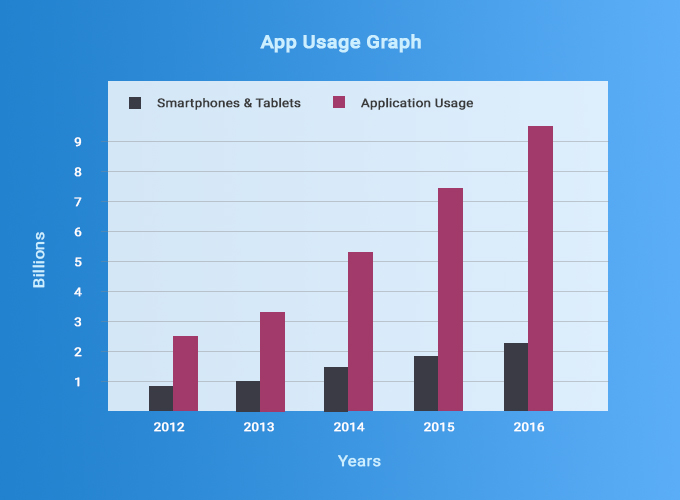
Statistical Data of Mobile and App Usage until 2016
Mobile app loyalty program
Mobile app users are increasing day by day, effective and efficient mobile apps always engage users in spending more time and frequency of usage. Every business owners get benefited through these app loyalty programs. For example, you go to a subway outlet and get 2 burgers, the same order you place it you get 1 free out of it. Through these are effective apps, business owners acquire plenty of new customers, users will never neglect the apps while there would be an increase in the frequency. The mobile apps are proven to be app loyalty.
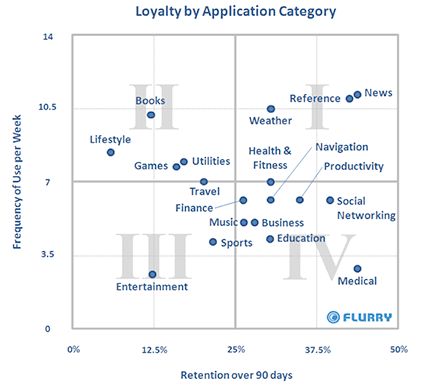
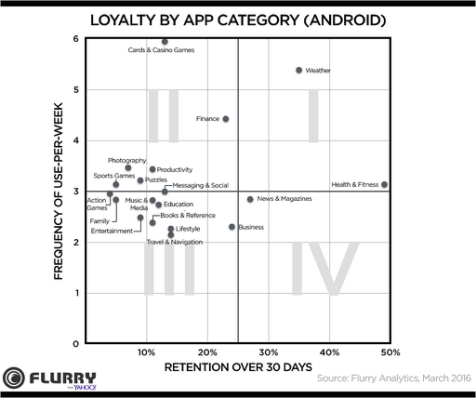
App Loyalty Matrix
According to the mobile app loyalty program, Flurry introduced the app loyalty matrix during 2012 which took in-depth understanding about the customer loyalty by app category. Today once again flurry plots the app category through the matrix and it is used as the frequency of days (plotted in x-axis) and the frequency of use per week(plotted in y-axis)
Retention Over 90 days Loyalty By App Category
 Reference: http://mashable.com/2009/09/30/flurry-app-retention/#InRLQqy.Kkqm
The above matrix represents four quadrants, each quadrant contains many app categories. Quadrant 1 apps are used most frequently and the users are loyal according to their time. Quadrant 2 apps are only used according to the trends but for a finite number of times. Quadrant 3 apps are all mixed ups and not used frequently. Quadrant 4 apps have low usage frequency but a loyal user base.
By looking at the above chart, the mobile app developers will determine under which quadrant their business model should be.
Below matrix represents how Flurry plots the median 30-day retention rate of the app categories for ios and android mobiles. The x-axis denotes the frequency of app usage per week on the Y-axis app store.
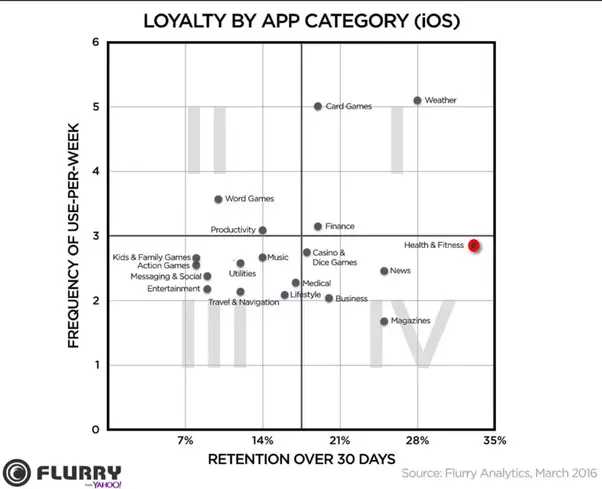 Reference: http://flurrymobile.tumblr.com/post/144245637325/appmatrix
How do I import data from the Flurry Analytics?
To import data from the Flurry Analytics you need 2 tokens, one is the Flurry API access code and the other one is the Flurry API key.
Create your own Flurry account and optimize your app experience by burgeoning and produce a great deal of profit for your organization, and follow the step by step guidance,
Completing the overall development processes like app designing, development, and testing, don’t you feel passionate how your app is functioning and how the users are engaged with your apps and the session duration? Try the Flurry Analytics and monitor your customer’s data and optimize to improve your app efficiency.
Comments by Ramya S